

Financial attributes are a key part of the psychographic marketer’s targeting toolkit. Slicing an audience based on banking and spending habits helps zero in on the users you want to buy a product, and it weeds out people you likely don’t. If you’re selling high-end home entertainment systems or investment services for the ultra-wealthy, your audience will look a lot different than if you’re trying to sell mortgage refinancing to credit union members.
In either case, Facebook has you covered. It offers 30 financial behaviors for advertisers to target based on where your audience keeps its money, how it invests it and what it uses for a payment method. In today’s installment of the Psychographic Targeting Hot House we’re taking a closer look at financial behavior targeting segments and where they come from.
Banking: Where your audience keeps its money
Facebook offers three segments to target based on where users do their banking: Credit unions, national banks and regional banks. The first thing to note here is the segment sizes ranging from 2.26 million to 5.38 million people. With 220 million Facebook users in the United States – and 93 percent of American households having some type of bank account – we would expect these numbers to be way higher.
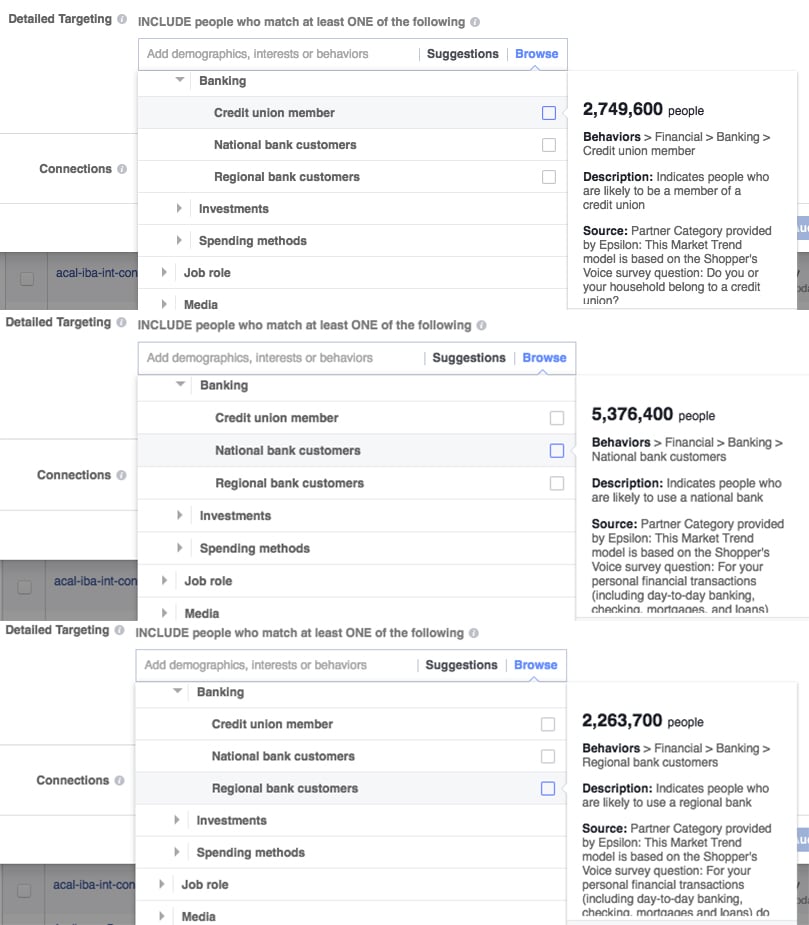
So what gives? The answer may be in the data source. Coming from Epsilon, these segments are modeled based on survey questions. That may mean it isn’t a big enough survey to model massive segments covering that 93 percent of households.
Tip for targeters: Don’t rely solely on these small banking behaviors to identify banking customers. You’ll need to dig deeper into behaviors, interests and demographics to make sure you hit your audience.
Investments: How your audience saves its money
This gets into meat and potatoes targeting. There are seven segments here covering the type of investing and how users go about it, i.e. whether they do it themselves or with an advisor.
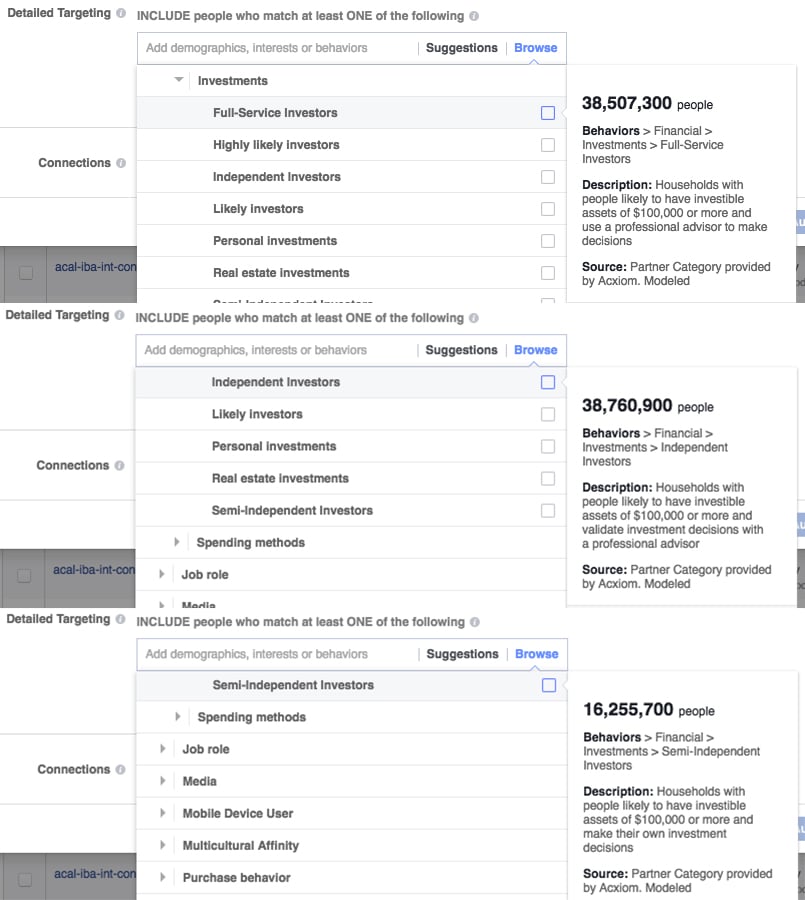
Three of the segments identify users likely to invest on their own or through a financial advisor. These investor types include households that most likely have investment assets worth more than $100,000: Full service, independent and semi-independent investors. Why set the cutoff at $100,000? Facebook doesn’t explicitly say. We can deduce it may have something to do with the fact that less than 10 percent of financial advisors will take clients who don’t have at least $100,000 to invest.
Tip for targeters: That makes these three segments the most lucrative for financial advisors because Facebook (and Acxiom) already screened out people without enough assets to become leads. It also makes these segments worth consideration as indirect wealth and income signals.
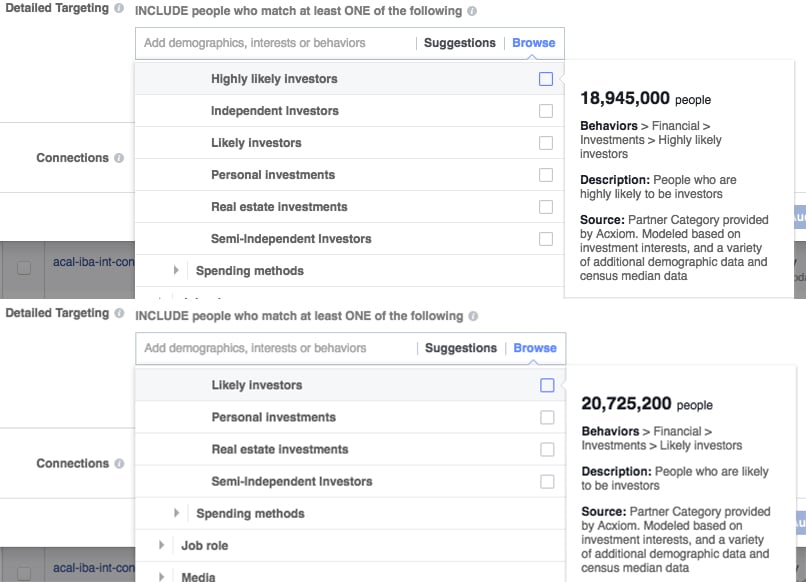
The next two investment segments target people by how likely they are to be investors, regardless of if they do it themselves or through an advisor. Separated as simply likely and highly likely, these are considerably smaller than the investor type segments. Facebook gives us a little more source detail here by telling us the Acxiom model is based on investment interests, demographic and census data.
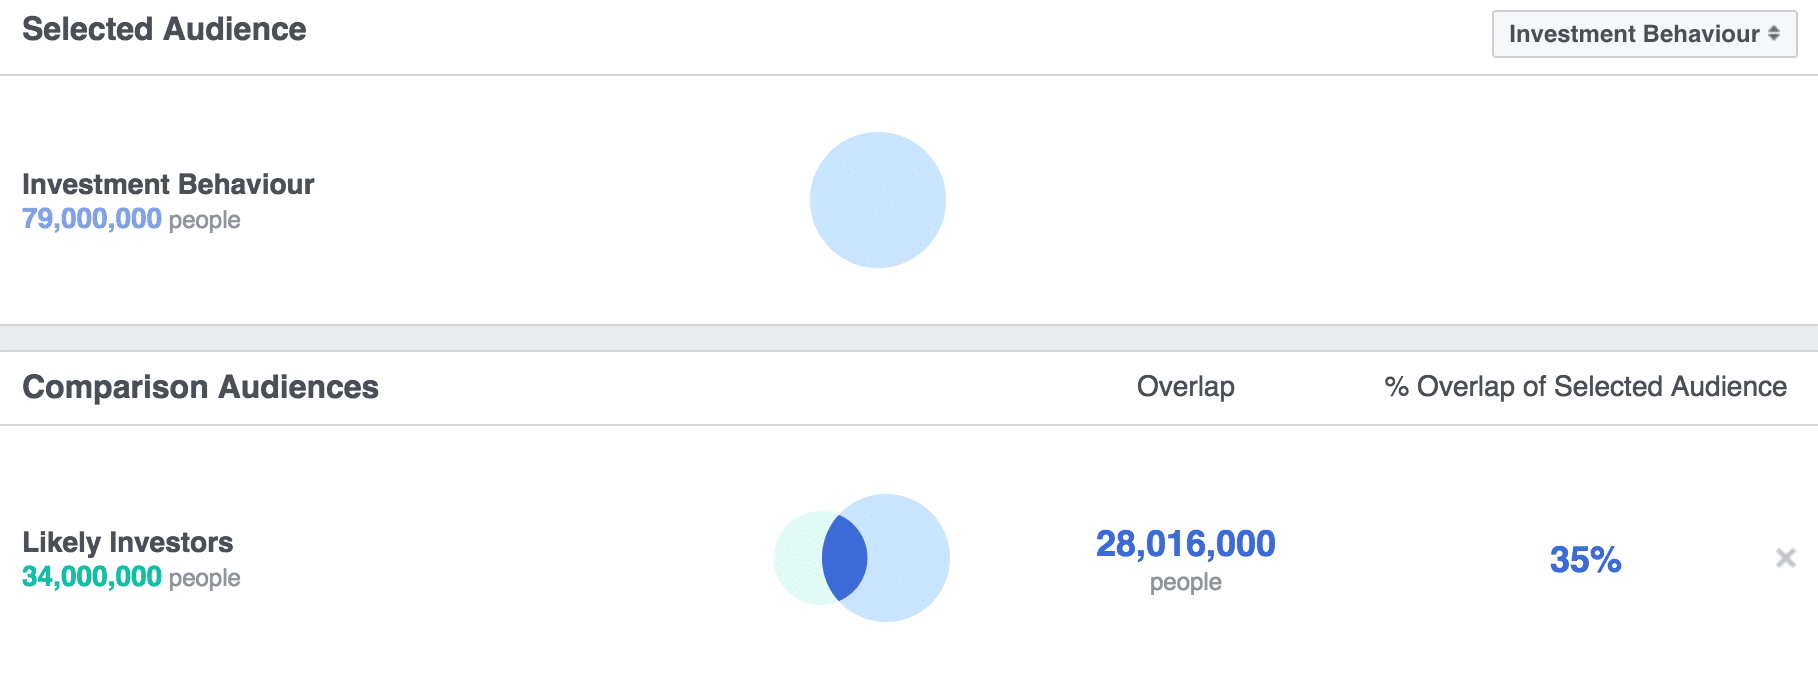
Tip for targeters: Watch for overlaps if you’re running separate ads to these and the investor type segments.
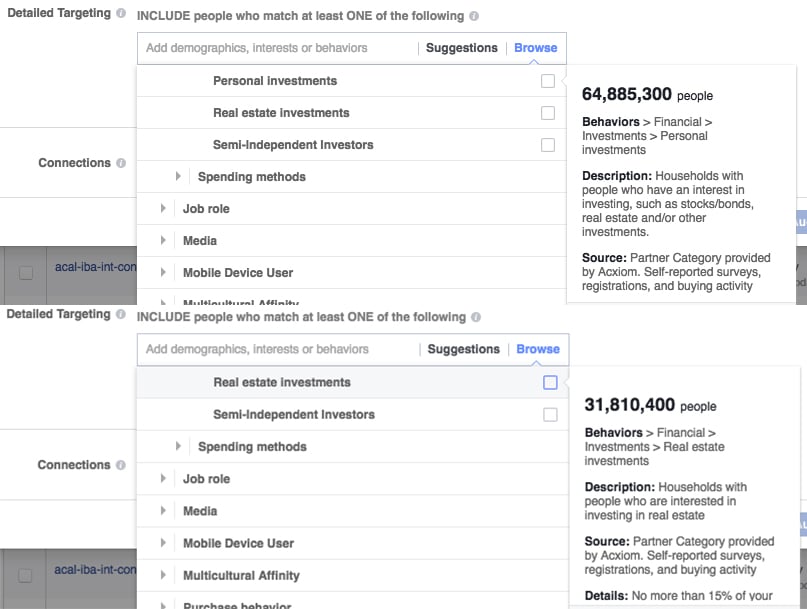
The last two investment segments are real estate investors and personal investors. We grouped these seemingly unrelated segments because they both come from registrations, buying activity and self-reporting. Be sure to note that they only represent people who are interested in personal and real estate investing, not necessarily people who are active investors. If you’re a financial services provider and you want to cast a wide net, these segments look to be good for very top-of-funnel prospects.
Before we get to the third group of financial behaviors, we should note a detail you might have seen in the screenshots: No more than 15 percent of your spend will be used to cover data costs. Say what now? According to Facebook: “When you’re using Partner Categories, our system reduces your bid in the auction by no more than 15 percent to cover data costs.” It choses to do it that way, it says, so you aren’t charged more than what you bid. Should this scare you away from using Partner Category data? NO! But it’s something to be aware of as you look at costs and performance. Now back to our regularly scheduled blog post…
Spending methods: How your audience pays for stuff
The last and biggest category of financial behaviors in Facebook targeting is spending methods. From people who primarily use cash to people with nine (nine?!?) credit cards, these segments cover how people pay for what they buy.
We’ll cover that person with nine credit cards first. There are segments targeting people who have from one up to nine lines of credit. It counts all credit cards, so it’s not that outlandish when you consider banks, retail, gas stations, airlines and the like. Segment sizes drop off pretty quickly after people with three lines, but we tend to give the data credibility because of its source. It comes from warranty registrations and buying activity (via Acxiom). Survey responses and self-reported data have worth, but registrations and buying activity show actual consumer actions.
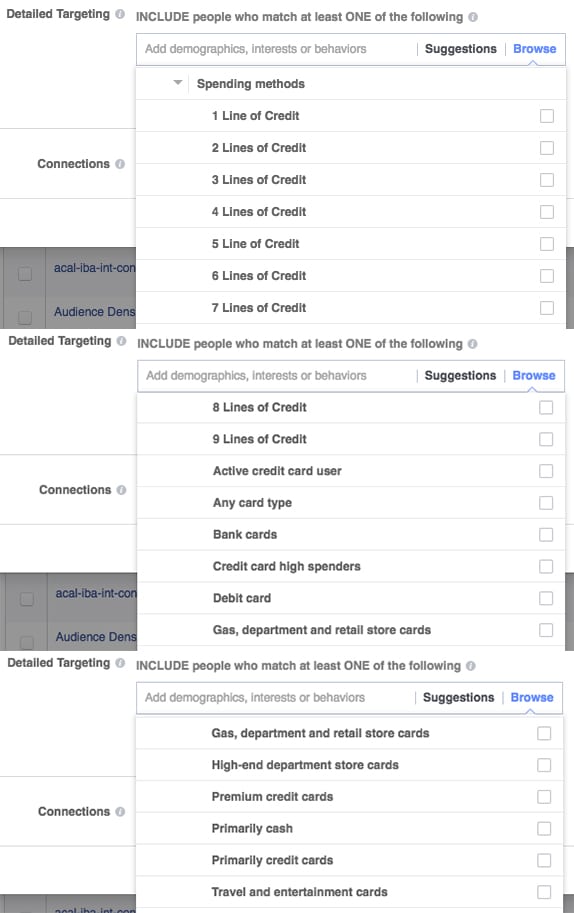
The other 11 spending method categories would more accurately be termed payment methods. They range from the overly broad “Any card type” to the hyper-specific high-end department store cards. To assess their quality we again look at their source.
In this case, almost every source is surveyed or self-reported. One segment – debit card users – is from the Epsilon Shopper’s Survey. The “Credit card high spenders” segment also comes from Epsilon, but lists as being multi-sourced. Specific credit card types – banks, retail stores, travel, etc. – all come from self-reported Acxiom data, while the primary cash and credit card user segments come from Acxiom with no hint as to how the data is gathered.
What about demographics?
What about demographics! We talked a lot about money and spending in this THH, so we owe a comparison to how Facebook targets income and net worth in the demographic segments.
Income. Income data comes from Acxiom either through self-reported survey responses or estimates based on a number of categories that center around work, residence and geography.
Net worth. No survey data here. Net worth is modeled based on another variety of factors that Acxiom thinks give insight into a person’s net worth: Age, home, vehicle, investment interest, census data and more.
This is more detail than Facebook gives for any of the financial behaviour segments, so those won’t supplant demographics as the best way to specifically target wealth and income. But like we mentioned above, refining an audience with investment signals is something smart marketers should consider.
All together now
We’ll leave you with a look at every data source in the financial behavior targeting bucket, along with the audience size for each segment. These slices of the Facebook universe are great tools to help you refine an existing targeting strategy or to set as the foundation for a new digital marketing initiative. Happy targeting!
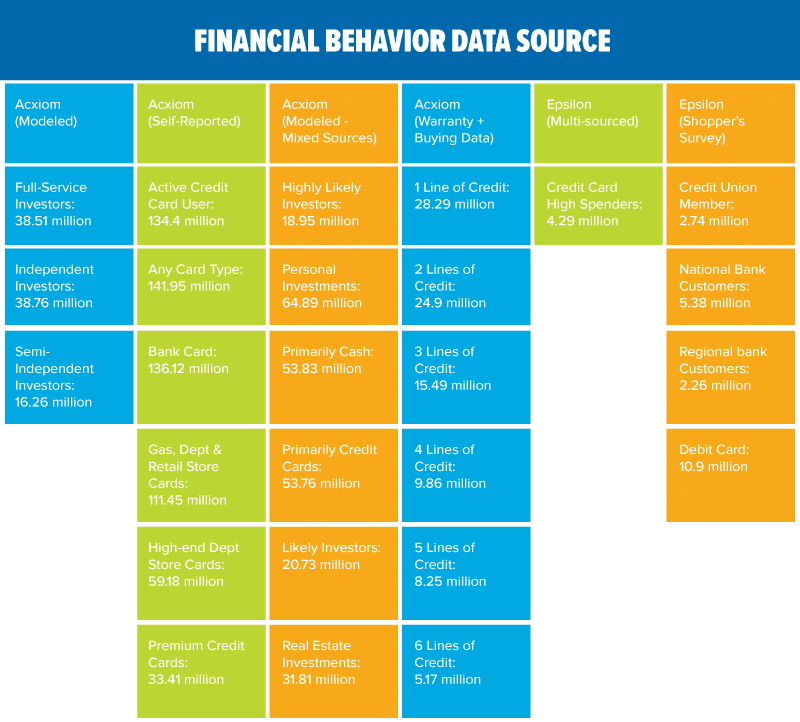
Image credit: urfin/Shutterstock.com


